Q&A
Instructions
The user interface should be pretty intuitive to use. Go to the Charts tab. There should be map, centered on Boston, or the position you checked on your last visit.
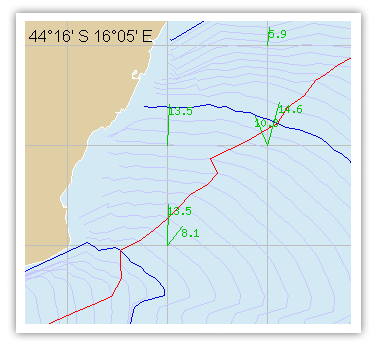
The chart shows the following elements:
- Numbers in the upper left corner indicate the latitude and longitude of the mouse pointer.
- Blue lines (isochrones) represent all possible boat positions in certain moment of time.
- Thick blue lines indicate the 12-hour in-game forecast update. Thin lines are spaced 1 hour apart.
- The black/red line indicates the predicted track. See the limitations.
- Black dots represent course changes. Hang above them with the mouse pointer for details.
- Information window appears in the upper right-hand corner on boat data refresh. It has red background if TWA is below 37° or above 150° or sub-optimal sail is used at the current TWA. Click it to show and hide details.
- Blue dots represent friends from the game. Friends can be turned on or off by pressing the blue dot button in the toolbar
- The green flag shows the current destination point.
- Big red dots show the gates which you should leave to port side (pass south of them).
- The thick orange line shows the Great Circle direction to the destination.
Controls: Most tasks can be done in 2 or 3 different ways. Some of them may not work well in some browsers, like right click in Opera (can be enabled in the configuration, but still shows the browser menu and needs pressing Escape)
- The right mouse button (and Control-click in Mac OS) opens a context menu. It lets you change starting and destination points and turn automatic routing around the marks on/off
- Zooming is done with the mouse wheel, the + / - buttons in the toolbar, or by directly clicking the zoom level indicator bars.
- Numbers 1 2 3 5 7 in the toolbar set the length of the predicted track in days. You can observe the effect of the shot and long-time forecasts on the suggested route. A 7-day run may notice weather system few days in the future and route around it, but the shorter forecast will keep straighter line.
- The next combo control (showing Off by default) changes the displayed weather forecast time.
Clicking it shows a menu with Off, Animation and 0 .. 168 options. Forecast times correspond to those in the game.
Forecast can also be changed with the mouse wheel over that control, or by clicking the small black arrows
Clicking a black dot along the path displays the related forecast (the next one, if it is on a 12h isochrone)
Wind speed and direction are shown numerically in the chart at the two maximum zoom levels. - Shift-click over the chart changes the starting position. Control-click and alt-click (at least one of those should work in your OS/browser) change the destination point.
- The last toolbar button switches to full-screen mode
The 'Leave marks to port' option works only if your track is long enoug to reach the mark in time. It will route in odd directions othewise (like Greenland in Leg 7).
Recommended use
Following each and every suggested turn may not be a good idea for several reasons:
- Long-term tracks are affected by weather forecasts too far in the future to be rally probable. That introduces track changes every 6 hours, sometimes radical if the optimizer chooses to go on the other side of weather system or island. Real difference may be one mile, but only the shortest track is displayed.
- Short term tracks show variations of few degrees because of the discrete nature of the game. It is safe to ignore that small variations most of the time, unless they lead to sub-optimal TWA or sail choise.
It is generally preferred to sail in straight lines as much as possible. Turning too much slows down both real and virtual boats
To make the best use of this tool you should observe the long-term forecast, decide on some strategy and stick to it. Then use short-term forecasts with near destination points for tactical planning. Humans are still much better than computers when it comes to pattern recognition.
You can open several windows/tabs for different boats and they should not affect each other. The full-screen page should keep its state (boat and chosen destination) if bookmarked.
General questions
Q: Where the forecast comes from?
A: It's taken directly from NOAA. This makes it possible to update earlier and have 172-hour forecast data. The current wind data in this site and the game itself should always be the same (let me know if it is not so), but the 12, 24 and 36h forecasts will drift apart with the 6-hour updates of the GFS model. This should give some advantage in unstable weather conditions.
Q: When is the forecast updated?
A: At the times the GFS model comes out: 05:00, 11:00, 17:00, 21:00 UTC. That means there are two 4-hour intervals in which it's not forecast but exact prediction of the game future, so the simulation of the first 8-12 h should be nearly exact.
Q:What is optimal weather routing?
A:It is old and widely used idea - predicting possible future
boat positions with the use of weather forecast data, boat performance data and some processing power.
You can see it implemented in the
race viewer or even see the racers using it
on tablet PCs on board in the official videos.
The Wikipedia article has more information.
Planned features
This is list of new features suggested by users and a few my ideas with brief comments, in no particular order:
Numeric data
The most requested one. Mostly done. Needs some formatting and boat speed and best sail indication.
Display forecast timestamp
Done. The Forecast field in the boat info panel shows which GFS data is used.
Display current boat data from the game server on refresh
Make it blink to tell you you are doing something stupid. I often forget changing sails while
writing code. Lost 1000 places today because of forgotten genoa.
Done.
Export data to VRTool and/or other text-based format
Should make comparing tracks easy. Also makes easier for bots to steer, which I don't exactly like.
Cheating kills the spirit of the game for me, but bots can't be avoided unless we go sailing real boats.
Export to kml.
Zooming
Much requested but not too easy to implement with current architecture.
Maybe untie zoom level from prediction duration and introduce one more level.
Done. Six zoom levels on a seamless world map.
Displaying wind information
The usual wind grid.Numbers in the chart itself
Done.
Selectable destination
I like this one. The only problem is it kills the
idea of caching the routes and may overload the server if too much people start using it
Done.
Display on google maps
Done.
The optimum tracks are now available at pathtrack.appspot.com. Several tracks and sets of isochrones can be seen simultaneously.
Spend some time on the optimizer itself
It works, but can be made a bit better. Try some ideas like optimum route
with some constraints - you cannot do sail change and/or have to rely on the autopilot
while going to the pub.
Handle broken or missing (for other races) sails too. Both in the simulator and the warning window.
Known issues/limitations
No attempt is made yet to avoid redundant tacks/jibes which occur in certain conditions. This generates ugly zig-zags, especially at small time steps. Needs additional work.
It takes a lot of CPU cycles to do the routing, so the charts will be limited in resolution if there are too many users. That should give reasonable idea for short/mid term strategy, but having exact charts could be interesting in few ways like getting exact times and angles to program your auto pilot or waking up in the middle of the night.